Posts

Showing posts from August, 2012

Thin Layer Chromatography (TLC)

    
Image
Thin layer chromatography is another chromatographic technique used mainly to separate organic compounds. As in other methods this also has the two phases known as mobile phase and stationary phase. The mobile phase is an organic solvent. Stationary phase is SiO 2 (Silicon dioxide) applied on to an inert solid support. The inert material can be either Aluminum (Al) or a glass based tool. Both of these inert solid supports are commercially available. Inert solid support is essential because this technique is resistance to chemicals. SiO 2 is applied as thin slurry on this inert solid support to get maximum effects. In this technique very minute quantities of test sample is used. Thin layer chromatography is a highly sensitive and rapid technique. Thin layer chromatography includes the sections as following. Each section has a clear detail description. Mechanismof separation in Thin layer chromatography Procedure of Thin layer chromatography Identificationand quantifi
    

Quantification of Compounds in Paper Chromatography

    
Image
The separated compounds on the chromatogram are first identified. Then the identified compounds are quantified according to the requirement. Quantification can be a comparative study among the separated compounds or it can be an accurate reading by a well performed instrument. Measuring the intensity of the colour under UV light is a comparative study to a certain extent. Another quantifying technique is done by cutting the chromatogram fragment where the separated compound of our interest is present. Then carrying out a chemical analysis of that piece of fragment. Measuring the radio activity using the Geiger Muller counter is a method used to quantify compounds in a highly accurate manner.
    

Use of Chemical Reagents in Chromatography

    
Image
To locate the separated compounds in chromatogram gases, liquids and solids are used. Most common is spraying liquid chemicals on to the developed chromatogram. Such chemical that is been used in most chromatographic studies, is ninhydrin. Ninhydrin is sprayed to locate amino acids. After applying ninhydrin amino acids will be appeared in pink to purple colour. The reaction between ninhydrin and the amino acid as follows. The compound which is the outcome of the reaction will be pink to purple depending on the amino acid type.
    

Autoradiography in Chromatography

    
Image
Autoradiography method is for the detection of radio active compounds. This is done by labeling the molecules in the test sample with a radioactive tracer. The developing of the chromatogram is as usual as in the previous methods . Then the chromatogram is dried or heated under sun or in an oven. An x-ray film is kept on top of the dried developed chromatogram. The compounds having radioactivity will be appeared as dark spots on the developed X-ray film. And these compounds are separated according to their radioactive ability.
    

Observation Under Visible and UV Light in Chromatography

    
Image
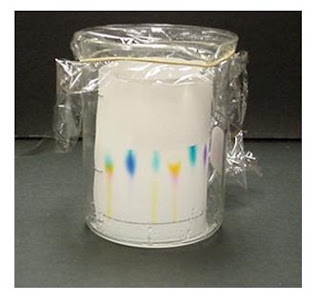
The colored compounds are easy to locate. And coloured compounds can observe using normal visible light. The colorless compounds are observed using UV light. The colourless compounds are located under UV light in two different wave lengths. Under 254 nm wave length the background of the filter paper will be light coloured and the spots will appear as dark spots. Fewer than 350 nm wave lengths the background of the filter paper will be dark and different coloured spots will be appeared.   
    

Spot Location in Chromatography

    
Image
In chromatography after the development the main process is the spot identification. It is also termed as spot location. This is highly essential in order to verify the compounds present in the mixture. This process becomes complicated when identifying a complex compound. If the compounds are coloured the process becomes quite easy. But always this is not the case! Sometimes nothing is visible in the developed chromatogram. However we scientists need to clarify those in order to solve the problem further. Hence now days there are several techniques available to locate these spots. And with the improvement of the technology these have become very easy and also quick. Following are some of the methods of locating spots, Observationunder visible light and UV light in chromatography Autoradiographyin chromatography Useof chemical reagents in chromatography
    

RF Value in Chromatography

    
Image
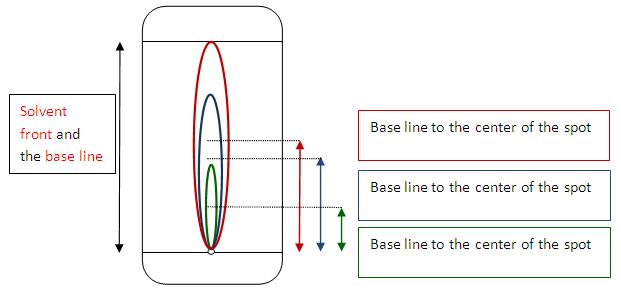
RF value is the degree of retention of a component retardation factor. RF value does not have units since the both lower and upper cases are in distance. Here the distance is measured up to the center of the spot. RF value = (Distance traveled by the component) / (Distance traveled by the mobile phase) The mobile phase travels up to the level of solvent front. We must carefully observe whether the mobile phase develops over the level of solvent front.  RF indicates the relative rate of movement of a solute and the solvent. RF value is a characteristic for a given substance under given conditions.
    

Two Dimensional Techniques in Paper Chromatography

    
Image
Two dimensional technique is another complex set up which is used to separate complex mixtures. In this method the development of the chromatogram is done as in the previous methods . Solvent is placed at the bottom of the tank and the filter paper saturated with the stationary phase is then kept inside the tank. The development occurs up wards. But very slowly because it is against the gravity as well as the compound is a complex one. After few hours the filter paper is turned 90 0 clockwise and the tank is filled with a different type of solvent. If there is no pronounced separation then development is proceeded to the “c” stage. Again the filter paper is turn 90 0 clockwise and used another solvent. This will probably end up with a satisfactory separation. If not again it should be turned and use another solvent. Although this will take some time, this allows a high degree of separation.
    

Paper Chromatography Descending Method

    
Image
The descending technique is a complex setup. This is built due to its time consuming ability. This develops along the gravity. Thus there is a force which will make the separation quick and easy. The filter paper is attached to a paper support. And the developing solvent (mobile phase) is filled into a chamber. The filter paper is saturated with the stationary phase before it is hung.  The mobile phase will gradually move downwards carrying the spot of the test sample along the paper. The term descending is given because the separation or the development of the chromatogram is taking place towards down . In this technique most polar substance will be on the top with respect to the tank where as the least polar ones will be at the bottom.
    

Paper Chromatography Ascending Method

    
Image
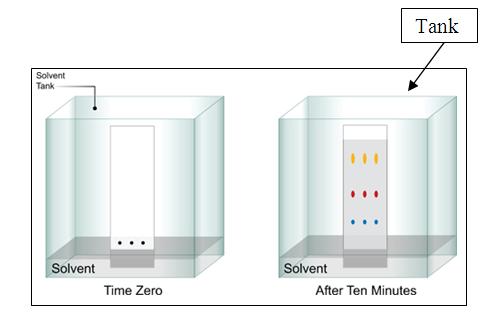
In ascending technique the chromatogram is attached in a way that the spot is touched with the solvent where the solvent is at the bottom. The development of the chromatogram or the separation of the spot is against the gravity. This is why this is termed as ascending technique. There is a paper support on the top of this tank. The mobile phase (solvent) is at the bottom of the tank. The filter paper is attached to the tank by the paper support and filter paper will touch the solvent. But the spot should not touch the solvent. The mobile phase will gradually rise up wards and carry the spot substances. The most polar substance will be at the bottom with respect to the tank where as the least polar will be on the top end of the tank. Ascending technique is relatively a slow process.
    

Methods of Development in Paper Chromatography

    
There are three methods of developing a paper chromatogram. This is to separate different substances according to their solubility abilities. Since different compounds have different characteristics the development technique of this particular type chromatogram differs in three formats. Those are as below, Ascendingmethod in paper chromatography Descendingmethod in paper chromatography Twodimensional techniques (2-D) in paper chromatography These are different by the way that the spot develop it into a chromatogram. In some cases the chromatogram develops against the gravity where as other it develops along the gravity. The detail explanation can be studied in the here .
    

Procedure of Paper Chromatography

    
Image
The spot of the test sample is loaded on the filter paper using a capillary tube. This spot should always be a concentrated but a very minute one. Capillary tubes are used in paper chromatography, because a small quantity can be taken into the tube without any force. The upper line (solvent front) is drawn on the paper from 2 cm on the top and the bottom line (base line) is drawn from 2 cm from the bottom of the paper. Usually 0.01g of the sample is dissolved in the running solvent (1g). Micro liter quantities are used to spot on the paper by a capillary tube. The diameter of the spot should be only up to few mili meters. The spotting should be done several times in order to get a concentrated spot. This filter paper is then placed inside the chamber saturated with the solvent to develop the chromatogram. The chromatogram is then heated in an oven to high temperatures. This can be done not only by an oven but also using a fan, air etc.
    

Paper Chromatography Separation Mechanisms

    
Image
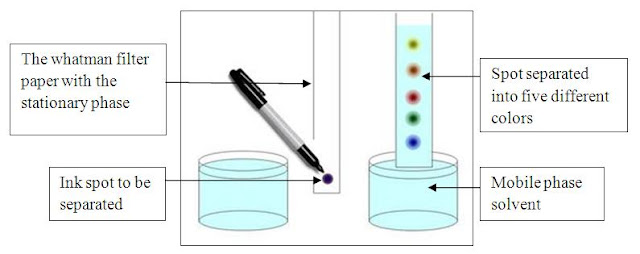
The mobile phase rises up by the capillary action. The testing sample is concentrated as a minute spot at the bottom of the filter paper. When the mobile phase which is a liquid, rises up in the filter paper the spotted mixture is gradually rises with the mobile phase. This eventually leads to the separation of the compounds. Compounds in the mixture will be separated according to their ability of the solubility. In other words it is again the polarity as in open column chromatography . More polar substances will move slower and less polar substances will travel faster. Consider “A” substance is more soluble than “B” in the stationary phase, thus “A” will dissolve in that solvent. This means “A” is more polar than “B” with respect to the stationary phase solvent. Thus “A” will travel slowly than “B”. And “B” will elute first. This explains that substances that having more solubility in stationary phase move slower and substances having less solubility in stationary phase move fast
    

Paper Chromatography

    
Image
The mode of separation of paper chromatography is the partition and the basis for the separation is solubility. As in other chromatographic techniques this also has a stationary phase as well as a mobile phase. Both phases are liquids. Stationary phase is water that is tightly bound to the paper. Filter papers are used for this purpose and most common filter paper used is Whatman filter paper- 98-99% Alpha cellulose. The cellulose paper can well absorb water molecules. Fiber of cellulose acts as the stationary phase. Mobile phase is a solvent- solvent partially miscible in water. Paper chromatography is usually used for separating amino acids and anions and also testing histamines and antibiotics. Paper chromatography will be discussed as in the following. Mechanism of separation in paper chromatography Procedureof paper chromatography Methodsof development in paper chromatography RFvalue in chromatography Spotlocation in chromatography Quantificationof compounds in pap
    

Compound Identification in Chromatography

    
Image
There are three main steps in a chromatography technique. Those are the separation, identification and the quantification. The eluted fractions of a complex mixture, from the separation process of a chromatography technique should be identified. It can be a colored fraction or a radioactive fraction or else can be a compound emitting florescence. Not only these, there can be so many different types! If it is a colored compound usually the task is very easy. But in practical it is not always colored! Colorless compounds can be identified by TLC (Thin Layer Chromatography), Gas chromatography or High performance liquid chromatography.
    

Running the Chromatogram

    
Image
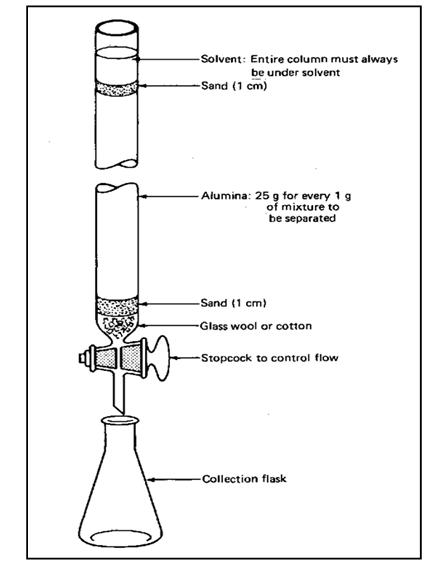
The stopcock of the glass column is packed with the glass wool. The glass column is then filled with the adsorbent in dry or in wet condition. Then a thin layer of glass beads are placed on top of the packing material. On to the top of the glass beads the solvent is added so that the solvent or the mobile phase can percolate through the glass beads. Before the addition of the test sample the packing material should be saturated with the solvent (mobile phase). Solvent is filled into the column while the stopcock is open. This is to verify whether the packing material (stationary phase) is saturated with the solvent (mobile phase). When it is fully saturated the excess solvent is passed through the stopcock which is open. After knowing it’s is fully saturated the stopcock is closed. Then the sample is added onto the top as a solution. Draw the solution from the bottom while adding from the top continuously. The packing material should be saturated throughout the process thus it is essen
    

Mechanism of Separation in Open Column Chromatography

    
Image
Mobile phase carries the test sample through the stationary phase. Solvent and solute molecules within the sample compete for the active sites on the solid adsorbent. Active sites are polar sites. Since the molecules are chosen by the stationary phase from the degree of their polarity, more polar molecules will be able to adhere on to the solid adsorbent than the less polar ones. Strongly adsorbed molecules take more time to elute out. Weakly adsorbed molecules will be eluted out with the solvent earlier. Separation is based on the polarity of the test sample that is carried by the mobile phase. If the test sample is a complex mixture then a sequential elution should be carried out. In sequential elution separation process starts from a less polar solvent and then the polarity of the solvent is gradually increased. So that elution of the molecules will take place in a polarity range which means least polar will come very first and most polar will be the last. In here several mobi
    

Parts of The Column and Its Procedure of Open Column Chromatography

    
Image
This is a glass column with two open ends. Usually in small laboratories a burette is used instead of a glass column. The upper end should be wider than the bottom end. Also at the bottom there should be a stopcock to control the solvent flow. The bottom end is packed with glass wool or cotton wool. It is to prevent the occurring of any damages to the stopcock from the solvent flow and to support the stationary phase. A solid packing material is filled as the stationary phase. The solid material can vary depending on the mode of separation such as adsorption, partition etc. The mode of separation of this technique is adsorption and the separation is based on the polarity of the substances. The stationary phase used in this is a finely divided polar material. It is finely divided in order to increase the surface area and it should be polar than the mobile phase that is used. Most common packing materials are silica gel (SiO 2 ), Alumina (Al 2 O 3 ) and also cellulose MgO and BaS
    

Open Column Chromatography

    
Image
The name open column chromatography is given to this particular chromatography is due to its open setup. There are two types of column depending on the size and the sample that is being used. Those are preparation columns and analytical columns. Preparation columns separate and purify large quantities such as grams or kilo grams. Analytical columns deal with very smaller quantities like milligrams and sub milligrams. The size of this open column chromatography mainly depends on the separation efficiency required by the user, size of the sample that is being used and the type of chromatography required. Open column chromatography will be discussed as below. Partsof the column and its procedure of open column chromatography Mechanismof separation in chromatography Runningthe chromatogram Compoundidentification in chromatography
    

Affinity Chromatography

    
Image
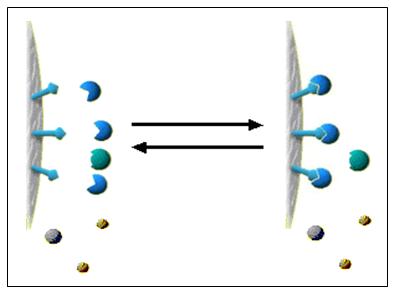
The stationary phase of this chromatographic technique is a gel matrix. And the mobile phase is a buffered solution. The blue arrows on the stationary phase are capable of attaching to their specific compounds those coming with the mobile phase. According to the theory of this technique, the shape of the compounds in blue color matches perfectly to the shape of the arrow head. Thus they are bound well to the stationary phase taking longer period to elute where as other compounds (yellow and dark blue) elute first. Thus the interaction is between one type of solute molecule in the test sample and the substance in the stationary phase (blue arrow).This reaction is a covalent interaction. This is mainly used in antibody testing assays. Test sample contains a mixture of proteins and immobilized molecule is an antibody to some specific protein. Only the specific protein is reacted to this antibody in the stationary phase. And this particular protein is extracted by changing
    

Size Exclusion Chromatography

    
Image
This separation technique is based on the molecular size. The stationary phase is a chemically inert material such as gels, porous inorganic solids, porous glass etc. Mobile phase is a water or aqueous solution which will serves only as a carrier for the analyte. The stationary phase of this chromatography is a porous material. This technique usually applies to larger molecules or macromolecules like proteins and industrial polymers. Also the stationary phase should not interact with the molecules. In here the medium sized compounds are trapped to the pores of stationary phase than the smallest and the largest ones. The size of the analyte (whether it is medium, small or large) depends on the pore size of the stationary phase. Smaller molecules experience more difficulties to pass through the stationary phase than large molecules do, because larger molecules which are bigger than the pores of stationary phase have very little entrance into pores.
    

Ion Exchange Chromatography

    
Image
This is to separate ionic mixtures. The stationary phase of this technique is an ion-exchange resins where as the mobile phase is a buffered aqueous solution. Anions or cations can covalently attach onto the resin. The resin can be either cationic or anionic. Solute ions of the opposite charge in the mobile phase attach to the resin by electrostatic forces. Ion exchange columns are of two types. Those are cation exchange columns (contains negatively charged groups) and Anion exchange columns (contain positively charged groups). In here the charged analytes are attached to the counter ions (exchange groups) in the column. Analyte ions are eluted out using a buffer with a different pH (to weaken the electrostatic interactions between the analytes and the exchangers. Analytes are present in the mobile phase where as the exchange groups present in the column.
    

Partition Chromatography

    
Image
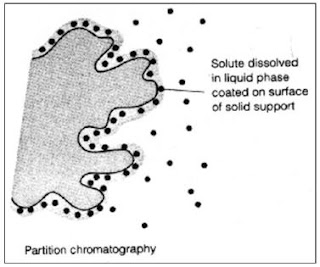
The stationary phase of this chromatography technique is a liquid supported on an inert solid. Mobile phase is either a liquid (liquid-liquid chromatography) or gas (gas-liquid chromatography). This is based on the compounds’ solubility. In other words difference in solubility is also due the differences in polarity. More polar substances are having higher affinity to the stationary phase. Less polar substances will go into the mobile phase. Paper chromatography comes under this type. 
    

Adsorption Chromatography

    
Image
The stationary phase of this particular technique is a solid material on which the sample compounds are adsorbed. Mobile phase is either a liquid (solid-liquid chromatography) or a gas (gas-solid chromatography). Adsorption is completely different from absorption. In here molecules are adsorb to a surface however molecules will not become a part of this section. Adsorption chromatography is based on the interaction between the solute molecules and active sites on the stationary phase. This attachment or interaction depends on the polarity of solutes. This techniques proves the statement that “polar like polar”. Because if the stationary phase is more polar than the mobile phase then high polar compounds in the mixture will tightly bound to the stationary phase where as less polar compounds will lightly bound to the stationary phase. Less tightly bound compounds will be eluted out by the mobile phase earlier than the tightly bonded ones. Thin layer chromatography, Open column
    

Classification of Chromatographic Techniques

    
There are several types of chromatographic techniques. These are based on the physical principle behind the separation. These are tabulated below. Mode of separation Basis for separation Adsorption chromatography Polarity Partition chromatography Solubility Ion exchange chromatography Charge Size exclusion chromatography Molecular size Affinity chromatography Biological activity