Posts

Introduction to Chromatography

Image
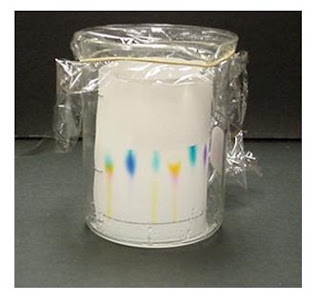
Chromatography is the science of separating mixtures from complex to simple. It is a collective term for a set of laboratory techniques as well as equipment used by scientists. Chromatography techniques are either preparative or analytical. These chromatography techniques are used by researchers and scientists throughout the world. It is indeed a need for researchers because these techniques can simplify the complex problem. Chromatography technology is used by several science-related fields such as medicine, microbiology, pharmacology, botany, chemistry, physics etc. “SCIENCE OF CHROMATOGRAPHY”  will provide you with a better understanding of different chromatographic techniques, their application, mechanisms, most popular modern chromatographic techniques and so on. We welcome all our readers to gain this precise knowledge of chromatography for your relevant tasks.  Topics covering... Chromatographic Techniques Common Chromatography Facts Gas Chromatography High-Performance Liquid Ch

Special Chromatography Techniques

    
Reversed phase chromatography A type of liquid chromatography. Mobile phase is more polar than the stationary phase (Not like other chromatography techniques) Pyrolysis gas chromatography mass spectrometry        -    Resulting simple molecules are subjected to a gas chromatography and then to a mass spectrometry.        -    Test sample is heated to decompose into smaller molecules.        -    Separated by GC.        -    Quantified by mass spectroscopy Pyrolysis :    Thermal decomposition of material in a vacuum material – quick heating 600- 1000 C Countercurrent chromatography -           A type of liquid – liquid chromatography -           Physical principle is solubility. -           Samples separate due to partition coefficient -           Types of CCC – HPCCC (High performance CCC) , HSCCC(High Speed CCC) -           Column rotates during separation. Chiral chromatograph -           Separates stereoisomer (Same fo
    

Flame Ionization Detector in Gas Chromatography (FID)

    
Image
Flame ionization detector is the most common type of detector used in GC. In flame ionization detector Hydrogen (H2) and Oxygen (O2) are present in the gas form. This will create a flame. The components that are eluting out will burn by the flame and will turn into ions. The formation of ions will ultimately create an electrical current. Electrical current depends on the components present in the sample. The following reaction will occur in order to form the electrical current.
    

Detectors in Gas Chromatography

    
Compounds elute out from the column is detected by this system. Simply detector tells the user that a compound has been eluted out. Detector generates a response which indicates the presence of a compound eluting from a GC column. The respond varies with the compound. Thus on the other hand detector not only detects the compound but also identifies the compound. This emphasizes that needfulness of a detector to GC is of utmost importance. There are two types of detectors. Those are as following, Flame ionization detector (FID) Thermal conductivity detector (TCD)
    

The Oven in Gas Chromatography

    
Image
The oven is a special feature present in Gas Chromatography where absent in other chromatography systems. This basically fulfill two main requirements, first is that column is installed in the oven. Second is adjusting a suitable environment for the chromatogram development.  The column temperature must be uniform throughout the time period until the components are eluted out. Thus to maintain the temperature of the column the oven is an essential system in a GC.
    

Capillary Column in Gas Chromatography

    
Image
Liquidized stationary phases are used in capillary columns. Capillary column has a unique structure compared to the packed column . Capillary columns are also very tiny tube like structures which are highly coiled. The internal diameter of a capillary column is around 0.1-0.53 mm.  The liquid stationary phase is coated as a thin film on the solid adsorbent which has been inserted into the coiled tube. This column type is longer than the packed column. Thus capillary columns may take more time to separate the test sample. On the other hand capillary columns do not need a large space in the GC system. 
    

Packed Column in Gas Chromatography

    
Image
Liquidized stationary phases are used in packed columns. Packed columns are very tiny, erect, tube like structures. The internal diameter of a packed column is around 2-4 mm. The stationary phase is packed inside this tiny tube, thus calling this structure as packed column. The stationary phase can be a single solid adsorbent or liquid coated solid adsorbent. Packed columns are not long as capillary columns . Thus the path length for the separation is slightly lower than the capillary column. Hence we can guess the packed columns separate the test sample much quicker than the capillary column. On the other hand use of packed columns takes more space than the capillary columns.
    

Columns in Gas Chromatography

    
Image
The stationary phase is the non-movable phase in chromatographic techniques. The mobile phase together with the test sample is moved through the stationary phase. During this passage of the mobile gas and the test sample the components in the test sample is separated. The stationary phase is packed inside a column in most chromatographic techniques. In Gas Chromatography two types of columns are used. Those are namely, Packed column   Capillary column   Depending on the packed material the column differs.
    

Injection Port and Sample Injection in Gas Chromatography

    
Image
The test sample is usually carried with the mobile phase. Then the test sample is gone through the stationary phase together with the mobile phase. In GC the test sample is inserted into the system via an injection port.  Like in HPLC  the test samples are injected into the chromatographic procedure. Injection is done through a self-sealing rubber system. And the test sample is injected using a gas-tight syringe. The gas tight syringe allows only micro liter amounts to be inserted in into the GC when using liquids as the testing sample. Then this is carried by the mobile gas. Together with the test sample the mobile gas is gone into the column where the stationary phase is present.
    

Carrier Gas in Gas Chromatography

    
Image
Carrier gas supply Every chromatographic technique includes a mobile phase and a stationary phase. Mobile phase is interacted with the stationary phase in order to proceed the separation. Basically the mobile phase is gone through the mobile phase together with the test sample. Which means the test sample is carried by the mobile phase. In gas chromatography the mobile phase is a gas. Thus in GC the mobile phase or the mobile gas is termed as the carrier gas. The carrier gas should perform several characteristics. Carrier gas should be inert, dry and free from impurities. The testing sample is either a gas or a liquid in GC. This test sample is carried onto the stationary phase by the carrier gas or the mobile gas. If carrier gas is a very reactive one, then it will perform a reaction with the test sample. If carrier gas contains moisture then of course the water molecules will react with the test sample. And also the presence of impurities will also interact with the test gas
    

Parts of Gas Chromatography

    
Image
Gas Chromatography is another type of technology used in separation of gases. This is a complex set of sections joined together to form a single instrument, thus making much easier to separate, identify and quantify the gases of interest. Unlike other chromatographic techniques in GC there is no need of developing chromatograms and other difficult time consuming things! It only matters a scientist or a technician who is capable of handling the instrument as well as the handler should perform good knowledge in chromatography.   Gas chromatography consists with a carrier gas supply, an injection port, a column, an oven and a detector. The detector output will be received by an integrator which is an instrument that will integrate the output signal. And the integrated signal is then recorded from a recorder. 
    

Gas Chromatography (GC)

    
Image
Gas chromatography or GC is a type of adsorption chromatography. The mobile phase of gas chromatography is a gas. This is the reason why this is termed as “gas chromatography”. The stationary phase can be either a solid adsorbent or a liquid adsorbent. If it is a solid adsorbent then this is called as “gas-solid chromatography” where as if liquid adsorbent then this is called as “gas-liquid chromatography”. In gas-liquid chromatography a non-volatile liquid has to use. Gas chromatography helps in many ways to detect explosive air pollutants, essential oils and very useful forensic studies.  The following topics related to GC will be discussed in detail.  Parts of GC Carrier gas in Gas Chromatography Injection port and sample injection  in Gas Chromatograph y Columns in Gas Chromatography Capillary column in Gas Chromatography Packed column in Gas Chromatography The oven in Gas Chromatography Detectors in Gas Chromatography Flame Ionization detector in Gas Chromat
    

Parts of High Performance Liquid Chromatography (HPLC)

    
Image
HPLC instrument has four main systems and three other systems which help to proceed HPLC accurately. The four main systems include mobile phase reservoirs, injector system, column and detector. The other three are the pump, waste and the recorder. The four main systems will be discussing in detailed in next pages. Mobile phase reservoirs in HPLC Injector system in HPLC Column in HPLC Detector in HPLC Pump mainly serves to move the mobile phase through the column. For this movement high pressure is required and it is given by the pump. The detector is connected to the waste and the recorder. Recorder will read the output given from the detector and it will produce peaks to indicate the detected compounds as relevant. Waste is to carry the unwanted outputs given from the detector.
    

Identification and Quantification in High Performance Liquid Chromatography

    
Image
In HPLC the detected compounds are identified. Identification of these compounds is done by comparing the retention time of the compounds with that of standard substances. Like in other methods after the identification the identified compounds are quantified. Quantitative analysis of compounds is done on the basis of the detector output (Chromatogram).
    

Physical Principals for Detecting Compounds in High Performance Liquid Chromatography

    
Image
In HPLC the compounds are detected by the section detector. Detection is based on different physical principals. These are UV absorption, fluorescence, radioactivity, IR absorption and electrochemical gradient. Detection by UV absorption is mainly based upon the ultraviolet-visible spectroscopy. Some compounds can absorb or reflect light which is in between the UV spectral region. Such compounds are detected through UV absorption spectroscopy. The compounds absorb light and the molecules of these compounds then undergo electronic transitions. This happens when these molecules contain non bonding electrons. These non bonding electrons can absorb energy in the spectrum of UV or visible light to excite these electrons to higher energy states. During electronic transitions of some compounds they undergo fluorescence. Fluorescence is a type of electromagnetic radiation. Also there are radioactive compounds which can be detected by relevant radioactive detectors. IR absorptio
    

Detector in High Performance Liquid Chromatography

    
Image
Detector Detector records the relative concentrations of different components of the test sample with respect to their retention time. Retention time is the time taken by the compound to elute from the column. Retention time is calculated from the time of injection until the compound is eluted. Detection is based on several different physical principals .  Those are UV absorption, fluorescence, radioactivity, IR absorption and electrochemical gradient. Depending on the characteristics of the mixture the physical principals will be different.
    

Column in High Performance Liquid Chromatography

    
Image
HPLC tube The separation of the compound mixture takes place in this column or HPLC tube. The HPLC tube is made up of stainless steel. The stationary phase is packed in the column and it is usually a solid adsorbent. In some instances the solid adsorbent is packed with a thin layer of water. Thus the physical principle or the mode of separation in HPLC is partition. As in other chromatographic techniques in HPLC the mobile phase with the test sample is gone through the stationary phase. And the compounds in the test sample are separated in here. Mobile phase serves only as a carrier of the test sample. According to the solubility differences (in other words polarity differences) the mixed compounds are separated.
    

Injector System in High Performance Liquid Chromatography

    
Image
Sample injection Like in other techniques, in HPLC the test sample is loaded into the stationary phase. But for this application HPLC has an injector system. The injector system loads the test sample into the stationary phase which is a column. Injector system contains an injector port, the place where the sample is injected.  In modernized equipments the injector port is auto sealed section which gradually seals itself after the sample is injected. This injector port is made from a slightly thick flexible material. Auto sealed injector ports should be changed with time by the user, because with time its auto sealing ability reduces. The sample is usually injected using a micro liter syringe.
    

Mobile Phase Reservoirs in High Performance Liquid Chromatography

    
Image
Solvent Reservoir Mobile phase reservoir will carry the mobile phase solution and through the pump it will be pumped into the column. This movement is according to the gravitational force. The mobile phase reservoir is a solvent with different polarities such as water, methanol, and acetonitrile.  These solvents should be highly pure. For an example, water should be used as de-ionized water. Hygienic conditions are facilitated with the use of 0.45 µm filter. The solvent is filtered through this filter mesh to remove all particulate matter. This is termed as Millipore filtering. Degas is done to minimize errors which occur when compounds interact with several gases. If degas or the removal of all the gases, is not done correctly then it may spoil the column .
    

What is High Performance Liquid Chromatography (HPLC) ?

    
Image
A sophisticated HPLC machine controlled by software   HPLC is unique highly sophisticated chromatographic equipment used to separate compounds that are dissolved in a solution. This is the reason why it is called High performance LIQUID chromatography. Also it is termed as High PRESSURE liquid chromatography is due to its mobile phase. Its mobile phase moves due to gravity. Unlike other methods HPLC includes all three sections in chromatographic equipment which are separation, identification and quantification. HPLC is an instrument or a machine which has all these three sections itself. At present HPLC methods are used that are controlled by software.
    

High Performance Liquid Chromatography (HPLC)

    
Image
High performance liquid chromatography is another method used for the compound separation. It is also termed as high pressure liquid chromatography. Unlike other chromatographic techniques this method is somewhat different due to its mobile phase’s unique character. Unlike other procedures the mobile phase of this HPLC moves due to pressure. In other words we can say mobile phase is moving in correlation with the gravitational force. In HPLC we will be focusing on the following topics. What is HPLC? Parts of HPLC Mobile phase reservoirs in HPLC Injector system in HPLC Column in HPLC Detector in HPLC Different physical principals for detecting compounds in HPLC Identification and quantification in HPLC
    

Advantages of Thin Layer Chromatography

    
Image
Readymade TLC plates TLC technique requires less time and fewer amounts of substances. More distinct individual spots make determinations easy. Strong reagents can use for the purpose of identification. TLC plates can be heated to higher temperatures without any damage.
    

Cladosporium Bio Assay in Thin Layer Cromatography

    
Image
Cladosporium bio assay is another identification method specific for the detection of antifungal compounds. Anti-fungal compounds are the substances that can act against fungi. In this assay Cladosporium spp. are used because of the characteristic features of their mycelium and the spores. The mycelium and spores of Cladosporium sp. is dull black in colour. This feature detects the anti-fungal compounds in contrast.  The spores of Cladosporium sp. (Microscopic view) The mycelium of Cladosporium sp. First a chromatogram was performed with the substances that are having different anti-fungal activities. Next a suspension of conidia of Cladosporium sp. is prepared. Then this is sprayed over the TLC plate. The TLC plate is then incubated. After incubation some areas can be seen in white where as rest of the whole area is black in colour. The black colour is due to the development of conidia of Cladosporium sp. White areas are the places where anti-fungal compounds are p
    

Identification and Quantification in Thin Layer Chromatography

    
Image
Identification is usually carried out by scraping off the eluted spots on the chromatogram and eluting them in analytical columns. The identified compounds then quantified using several methods. These can be quantified by densitometer, spectrophotometer,auto-radiography and fluorescence. Densitometry : Measuring optical density in light sensitive materials is done using a densitometer. This study is known as densitometry which is a quantitative study. Light sensitive materials are photographic paper or photographic films. The result of the darkness of a developed picture is termed optical density which can be expressed as the number of the dark spots in a given area. But this is usually a relative value expressed in a scale. The densitometer can be used in spot densitometry, line densitometry and bi-dimensional densitometry. Fluorescence : Fluorescence is the emission of light by compounds which have absorbed light or other electromagnetic radiation already. Usually
    

Procedure of Thin Layer Chromatography

    
Image
Thin layer chromatography (TLC) plate is prepared by application of a uniform layer of adsorbent on to a glass or an Aluminum plate. The application of the adsorbent can be done by pouring the slurry, spraying the suspension and use of commercial applicators. The slurry is made by dissolving SiO 2 in water. Also there are readymade TLC plates available in shops. Then this plate should be heated at 100 0 C -105 0 C for 30 minutes in an oven. This is to activate the plate and this activation should be done before the sample is loaded. There after the sample is loaded. When the sample is loading we must be sure to spot the sample several times in order to obtain a concentrated spot. But the diameter of the spot should not be exceeded 2mm. If the spot is large, then during the separation the lines of the compound will be not limited to the plate (B). And also if the spot is big and dilute then a peak of the line is difficult to observe. Then the plate is inserted into th
    

Mechanism of Separation in Thin Layer Chromatography

    
Image
Thin layer chromatography is another type of adsorption chromatography. Thus the basis for separation is the polarity. Polarity of the compounds in the test sample is compared with the polar stationary phase. The polar stationary phase is due to the presence of SiO 2 . When consider the polarity of mobile phase, it should always be relatively less polar than the stationary phase. Thus when choosing an organic compound as a mobile phase we must be highly concern of the polarity of the organic solvent. The glass solid support or Al solid support is applied with thin slurry of the SiO 2 and the test sample is spotted at the base line. This spot of the test sample should be a very concentrated but a minute one! With the rise of the mobile phase the spotted test sample is move up wards. Polar substances of the test sample are interacted with the stationary phase and travel slowly along the solid support. Less polar substances travel faster with the solvent. 
    

Thin Layer Chromatography (TLC)

    
Image
Thin layer chromatography is another chromatographic technique used mainly to separate organic compounds. As in other methods this also has the two phases known as mobile phase and stationary phase. The mobile phase is an organic solvent. Stationary phase is SiO 2 (Silicon dioxide) applied on to an inert solid support. The inert material can be either Aluminum (Al) or a glass based tool. Both of these inert solid supports are commercially available. Inert solid support is essential because this technique is resistance to chemicals. SiO 2 is applied as thin slurry on this inert solid support to get maximum effects. In this technique very minute quantities of test sample is used. Thin layer chromatography is a highly sensitive and rapid technique. Thin layer chromatography includes the sections as following. Each section has a clear detail description. Mechanismof separation in Thin layer chromatography Procedure of Thin layer chromatography Identificationand quantifi
    

Quantification of Compounds in Paper Chromatography

    
Image
The separated compounds on the chromatogram are first identified. Then the identified compounds are quantified according to the requirement. Quantification can be a comparative study among the separated compounds or it can be an accurate reading by a well performed instrument. Measuring the intensity of the colour under UV light is a comparative study to a certain extent. Another quantifying technique is done by cutting the chromatogram fragment where the separated compound of our interest is present. Then carrying out a chemical analysis of that piece of fragment. Measuring the radio activity using the Geiger Muller counter is a method used to quantify compounds in a highly accurate manner.
    

Use of Chemical Reagents in Chromatography

    
Image
To locate the separated compounds in chromatogram gases, liquids and solids are used. Most common is spraying liquid chemicals on to the developed chromatogram. Such chemical that is been used in most chromatographic studies, is ninhydrin. Ninhydrin is sprayed to locate amino acids. After applying ninhydrin amino acids will be appeared in pink to purple colour. The reaction between ninhydrin and the amino acid as follows. The compound which is the outcome of the reaction will be pink to purple depending on the amino acid type.
    

Autoradiography in Chromatography

    
Image
Autoradiography method is for the detection of radio active compounds. This is done by labeling the molecules in the test sample with a radioactive tracer. The developing of the chromatogram is as usual as in the previous methods . Then the chromatogram is dried or heated under sun or in an oven. An x-ray film is kept on top of the dried developed chromatogram. The compounds having radioactivity will be appeared as dark spots on the developed X-ray film. And these compounds are separated according to their radioactive ability.
    

Observation Under Visible and UV Light in Chromatography

    
Image
The colored compounds are easy to locate. And coloured compounds can observe using normal visible light. The colorless compounds are observed using UV light. The colourless compounds are located under UV light in two different wave lengths. Under 254 nm wave length the background of the filter paper will be light coloured and the spots will appear as dark spots. Fewer than 350 nm wave lengths the background of the filter paper will be dark and different coloured spots will be appeared.   
    

Spot Location in Chromatography

    
Image
In chromatography after the development the main process is the spot identification. It is also termed as spot location. This is highly essential in order to verify the compounds present in the mixture. This process becomes complicated when identifying a complex compound. If the compounds are coloured the process becomes quite easy. But always this is not the case! Sometimes nothing is visible in the developed chromatogram. However we scientists need to clarify those in order to solve the problem further. Hence now days there are several techniques available to locate these spots. And with the improvement of the technology these have become very easy and also quick. Following are some of the methods of locating spots, Observationunder visible light and UV light in chromatography Autoradiographyin chromatography Useof chemical reagents in chromatography
    

RF Value in Chromatography

    
Image
RF value is the degree of retention of a component retardation factor. RF value does not have units since the both lower and upper cases are in distance. Here the distance is measured up to the center of the spot. RF value = (Distance traveled by the component) / (Distance traveled by the mobile phase) The mobile phase travels up to the level of solvent front. We must carefully observe whether the mobile phase develops over the level of solvent front.  RF indicates the relative rate of movement of a solute and the solvent. RF value is a characteristic for a given substance under given conditions.
    

Two Dimensional Techniques in Paper Chromatography

    
Image
Two dimensional technique is another complex set up which is used to separate complex mixtures. In this method the development of the chromatogram is done as in the previous methods . Solvent is placed at the bottom of the tank and the filter paper saturated with the stationary phase is then kept inside the tank. The development occurs up wards. But very slowly because it is against the gravity as well as the compound is a complex one. After few hours the filter paper is turned 90 0 clockwise and the tank is filled with a different type of solvent. If there is no pronounced separation then development is proceeded to the “c” stage. Again the filter paper is turn 90 0 clockwise and used another solvent. This will probably end up with a satisfactory separation. If not again it should be turned and use another solvent. Although this will take some time, this allows a high degree of separation.
    

Paper Chromatography Descending Method

    
Image
The descending technique is a complex setup. This is built due to its time consuming ability. This develops along the gravity. Thus there is a force which will make the separation quick and easy. The filter paper is attached to a paper support. And the developing solvent (mobile phase) is filled into a chamber. The filter paper is saturated with the stationary phase before it is hung.  The mobile phase will gradually move downwards carrying the spot of the test sample along the paper. The term descending is given because the separation or the development of the chromatogram is taking place towards down . In this technique most polar substance will be on the top with respect to the tank where as the least polar ones will be at the bottom.
    

Paper Chromatography Ascending Method

    
Image
In ascending technique the chromatogram is attached in a way that the spot is touched with the solvent where the solvent is at the bottom. The development of the chromatogram or the separation of the spot is against the gravity. This is why this is termed as ascending technique. There is a paper support on the top of this tank. The mobile phase (solvent) is at the bottom of the tank. The filter paper is attached to the tank by the paper support and filter paper will touch the solvent. But the spot should not touch the solvent. The mobile phase will gradually rise up wards and carry the spot substances. The most polar substance will be at the bottom with respect to the tank where as the least polar will be on the top end of the tank. Ascending technique is relatively a slow process.
    

Methods of Development in Paper Chromatography

    
There are three methods of developing a paper chromatogram. This is to separate different substances according to their solubility abilities. Since different compounds have different characteristics the development technique of this particular type chromatogram differs in three formats. Those are as below, Ascendingmethod in paper chromatography Descendingmethod in paper chromatography Twodimensional techniques (2-D) in paper chromatography These are different by the way that the spot develop it into a chromatogram. In some cases the chromatogram develops against the gravity where as other it develops along the gravity. The detail explanation can be studied in the here .
    

Procedure of Paper Chromatography

    
Image
The spot of the test sample is loaded on the filter paper using a capillary tube. This spot should always be a concentrated but a very minute one. Capillary tubes are used in paper chromatography, because a small quantity can be taken into the tube without any force. The upper line (solvent front) is drawn on the paper from 2 cm on the top and the bottom line (base line) is drawn from 2 cm from the bottom of the paper. Usually 0.01g of the sample is dissolved in the running solvent (1g). Micro liter quantities are used to spot on the paper by a capillary tube. The diameter of the spot should be only up to few mili meters. The spotting should be done several times in order to get a concentrated spot. This filter paper is then placed inside the chamber saturated with the solvent to develop the chromatogram. The chromatogram is then heated in an oven to high temperatures. This can be done not only by an oven but also using a fan, air etc.
    

Paper Chromatography Separation Mechanisms

    
Image
The mobile phase rises up by the capillary action. The testing sample is concentrated as a minute spot at the bottom of the filter paper. When the mobile phase which is a liquid, rises up in the filter paper the spotted mixture is gradually rises with the mobile phase. This eventually leads to the separation of the compounds. Compounds in the mixture will be separated according to their ability of the solubility. In other words it is again the polarity as in open column chromatography . More polar substances will move slower and less polar substances will travel faster. Consider “A” substance is more soluble than “B” in the stationary phase, thus “A” will dissolve in that solvent. This means “A” is more polar than “B” with respect to the stationary phase solvent. Thus “A” will travel slowly than “B”. And “B” will elute first. This explains that substances that having more solubility in stationary phase move slower and substances having less solubility in stationary phase move fast
    

Paper Chromatography

    
Image
The mode of separation of paper chromatography is the partition and the basis for the separation is solubility. As in other chromatographic techniques this also has a stationary phase as well as a mobile phase. Both phases are liquids. Stationary phase is water that is tightly bound to the paper. Filter papers are used for this purpose and most common filter paper used is Whatman filter paper- 98-99% Alpha cellulose. The cellulose paper can well absorb water molecules. Fiber of cellulose acts as the stationary phase. Mobile phase is a solvent- solvent partially miscible in water. Paper chromatography is usually used for separating amino acids and anions and also testing histamines and antibiotics. Paper chromatography will be discussed as in the following. Mechanism of separation in paper chromatography Procedureof paper chromatography Methodsof development in paper chromatography RFvalue in chromatography Spotlocation in chromatography Quantificationof compounds in pap